Diagmaster
A technician can connect to the Kubota diesel engine by using Diagmaster software. Diagmaster communicates with the Engine Control Unit (ECU) and presents this in a user interface to observe and diagnose engine conditions.
Diagmaster is equipped with the following functions:
•Managing projects
•Reading and deleting DTC codes
•Monitoring the value and information in the ECU collected from sensors and actuators
•Forcibly driving actuators such as an injector
•Utility functions such as injector compensation and injection quantity correction
Figure 7.1 Diagmaster
In order to use Diagmaster to diagnose a Kubota engine, a user must be granted access through the Kubota Engine Park (KEP) website. A user must register on the KEP site for a username and password to Diagmaster.
Contact a Carrier service engineer for information on how to create a KEP account.
CPU |
1GHz or more recommended |
OS |
Windows 7 (32bit / 64bit versions); |
|
Windows 8/8.1 (32bit / 64bit versions) |
|
Windows 10 (32bit / 64bit versions) |
Memory |
2 GB or more recommended |
Storage |
20GB or more recommended |
Monitor |
1024 x 768 pixels, 256 colors or more recommended |
USB |
USB 1.1 / 2.0 at least 1 port |
7.2.3Software Installation Procedure
The installation files for Diagmaster are located on the Kubota Engine Park (KEP) website.
1.Login to KEP.
2.On the left hand menu, click on CRS Engine Technology and Service Information and select Diag Master update file.
3.Download the following three files from the Installer file column.
•Diagmaster Program
•Diagmaster Database
•DST-i Communication Interface Driver
4.Change all three downloaded file extensions from .z_p to .zip.
5.Extract all three zip files to a folder location.
6.Install each software package, one at a time. Install in the following order:
a.SetUp_Diagmaster_VerXX.XX.XX.exe
b.Diagmaster_Database_XX.XX.XX.XX_for_Carrier.exe
c.Setup_DST-i_KUBOTA_V400
7.The Diagmaster Launcher icon should now be on your desktop.
7.2.4Connecting a Computer to the ECU
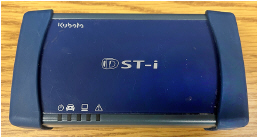
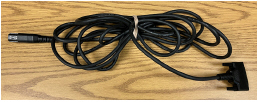
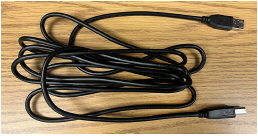
The Diagmaster Assembly Kit (Carrier PN 07-60198-00) contains all of the hardware necessary to connect a computer to the ECU.
•DST-i device
•Data link cable
•USB cable: USB-B (male) to USB-A (male)
Procedure:
1.Connect the USB cable between the laptop and the DST-i device.
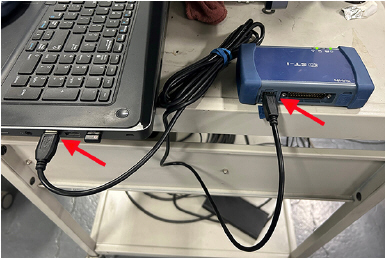
2.Connect one end of the data link cable to the DST-i device.
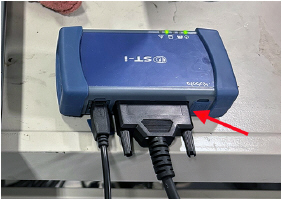
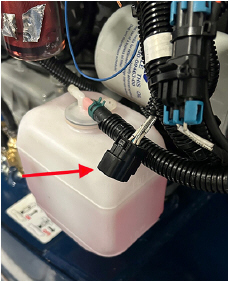
3.Locate the Data Link Connector (DLC) on the unit. Remove the dust cap.
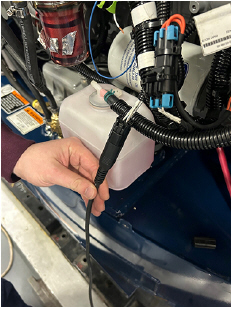
4.Connect the data link cable to the DLC.
5.Make sure the Engine START/RUN/OFF switch is in the RUN position. If diagnosis is required while the engine is running, turn the switch to the START position to start the engine.
1.To launch Diagmaster, select Diagmaster from the Windows start menu or click on the icon from the desktop.
2.If logging in for the first time, the Diagnostic tester’s selection screen will appear. Otherwise, you may be directed to the login screen.
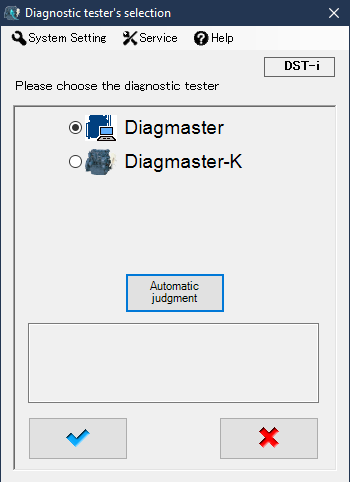
3.If user registration has not been completed, do that now:
a.Click on System Setting and select User registration from the drop down.
b.Fill in the user name, password and registration code fields. Refer to the email that was sent when registering for Diagmaster access on the KEP website.
4.Next, click on Automatic judgment. This will select the proper Diagmaster database to connect to. If an error message occurs after clicking the button, check the connections to the ECU.
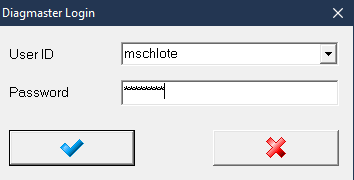
5.At the Login screen, enter a User ID and Password and click the blue checkmark button.
After logging into Diagmaster, the Top screen appears. From here the user click on the Menu button to choose the selected path.
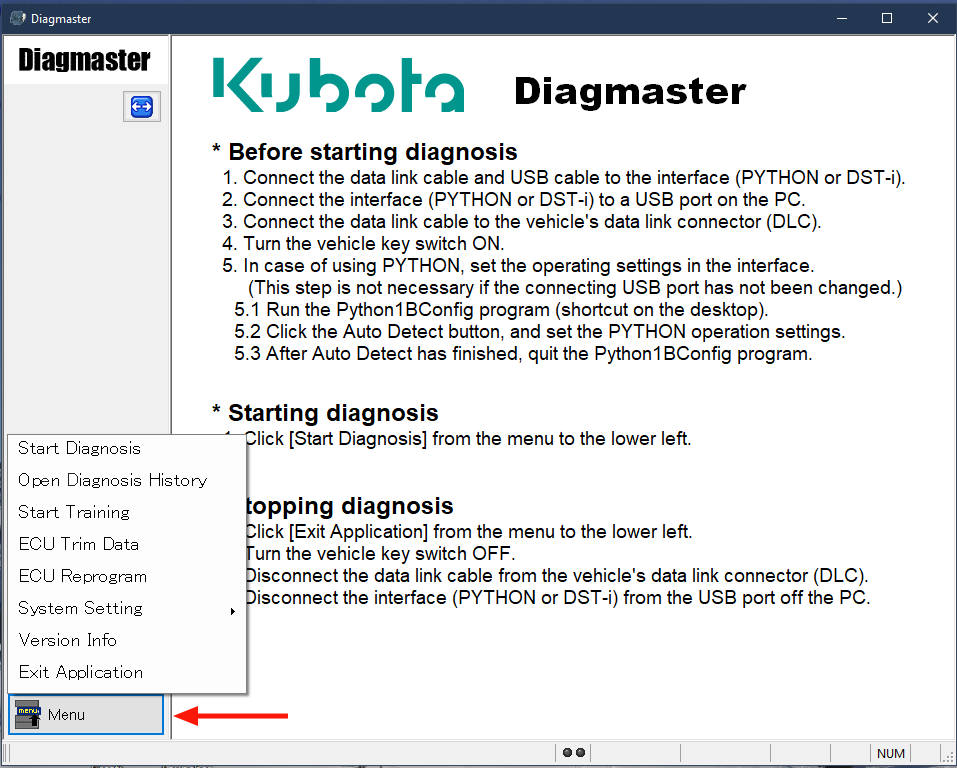
Menu Item |
Description |
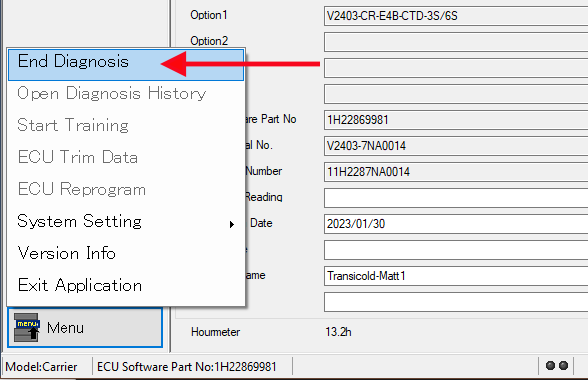
Start Diagnosis / Finish Diagnosis |
Connect the cable to the vehicle and start fault diagnosis. Or, if a diagnosis is already in progress, this will complete diagnosis. |
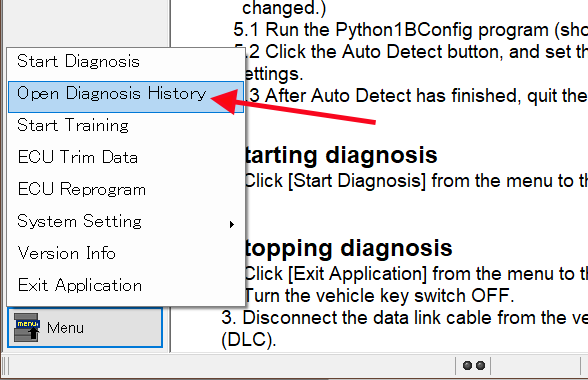
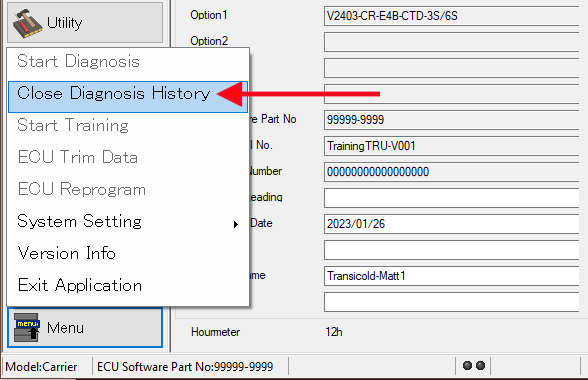
Open Diagnosis History / Close Diagnosis History |
Displays the past history of diagnoses. Or, closes the diagnosis history item currently replayed. |
Start Training / Finish Training |
Operates the software in training mode, without the vehicle connected. Or, stops the training mode and returns to normal mode. |
ECU Trim Data |
|
ECU Reprogram |
|
System Setting |
Selects the display language, specifies the communication interface and changes the password. |
Version Info |
Displays the Diagmaster version number. |
Exit Application |
Exits Diagmaster. |
A diagnosis is started to establish communication with the engine for diagnosis of fault conditions or performance.
1.Click on Menu and select Start Diagnosis.
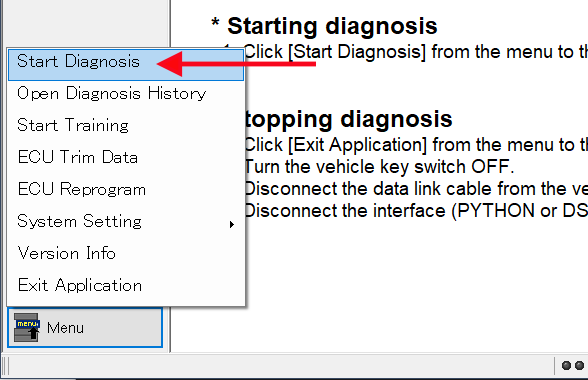
2.A screen will appear as a reminder to make sure preparations are completed. Click the blue checkmark to confirm.
3.Next, the Select Customer Info screen appears. Any diagnosis history is displayed on this screen.
•To restart a previous diagnosis, select the history item in the row, then click the Open Folder icon. This will resume that diagnosis.
•To start a new diagnosis, click on the New Project icon. A screen will appear to select the Vehicle Engine Type. The drop down fields may be grayed out to prevent any selections. The Customer Name field can be edited. Click the blue checkmark to confirm.
4.After communication with the ECU is established, the Project screen appears. Once the Diagnosis is started, the user can navigate between all of the various screens and perform actions, save data, etc until it is decided to end the diagnosis. See Section 7.3.5 for Project screen description
5.To end the diagnosis, click on Menu and select End Diagnosis. This can be done from any screen.
After diagnosis has been recorded, these events can be re-opened later to examine the results.
1.Click on Menu and select Open Diagnosis History.
2.The Select Customer Info screen appears. Any diagnosis history is displayed on this screen. Select the history item in the row, then click the Open Folder icon. Or, double-click an item to open.
3.The Project screen opens with the details of the diagnosis history that was chosen. See Section 7.3.5 for Project screen description.
4.When finished with viewing the chosen diagnosis history, click on Menu and select Close Diagnosis History.
The Project screen appears initially after a Diagnosis is started or opened. From the Project screen, the fields that are not grayed out can be edited and saved. You can change the information entered in the Project screen at any time during diagnosis, but the Save button must be clicked to save changes.
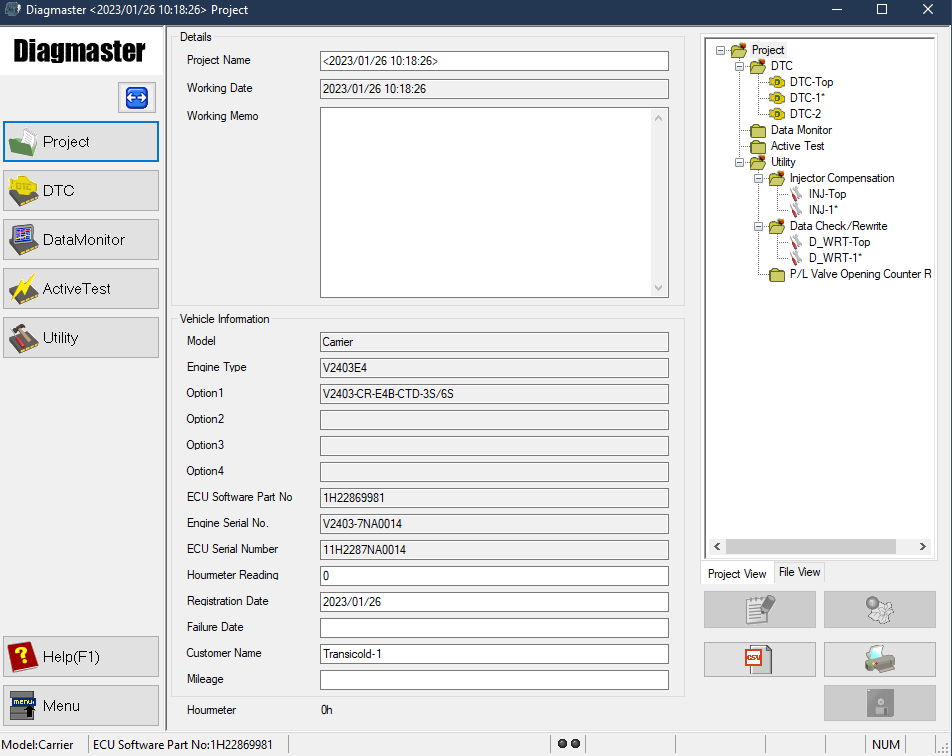
The Project Info List is displayed on the
right of the Project screen.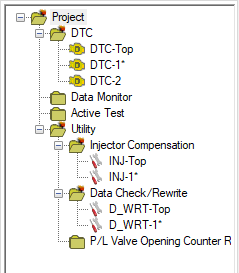
•Items in the project can be deleted by right-clicking on the item.
•Items with filename “****-TOP” can not be deleted. This is data when starting a new diagnosis.
•Items with a filename that ends with an asterisk (*) specify initial data obtained after a diagnosis restart.
•Items in the project list can have memos viewed and edited by right-clicking on the item.
•The DTC folder displays DTC error code and freeze frame data that is saved from the DTC screen during a diagnosis.
•The Data Monitor folder displays monitored data saved from the Data Monitor screen.
•The Active Test folder displays monitored data saved from the Active Test screen.
•The Utility folder displays data saved from the Utility screen.
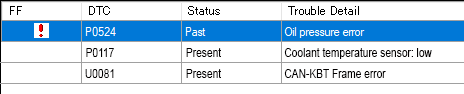
The DTC screen displays the DTC error codes that are past and present in the ECU. The DTC codes are listed individually in the Section 6.3 of the Troubleshooting chapter of this manual, with description and recommended causes of the error.
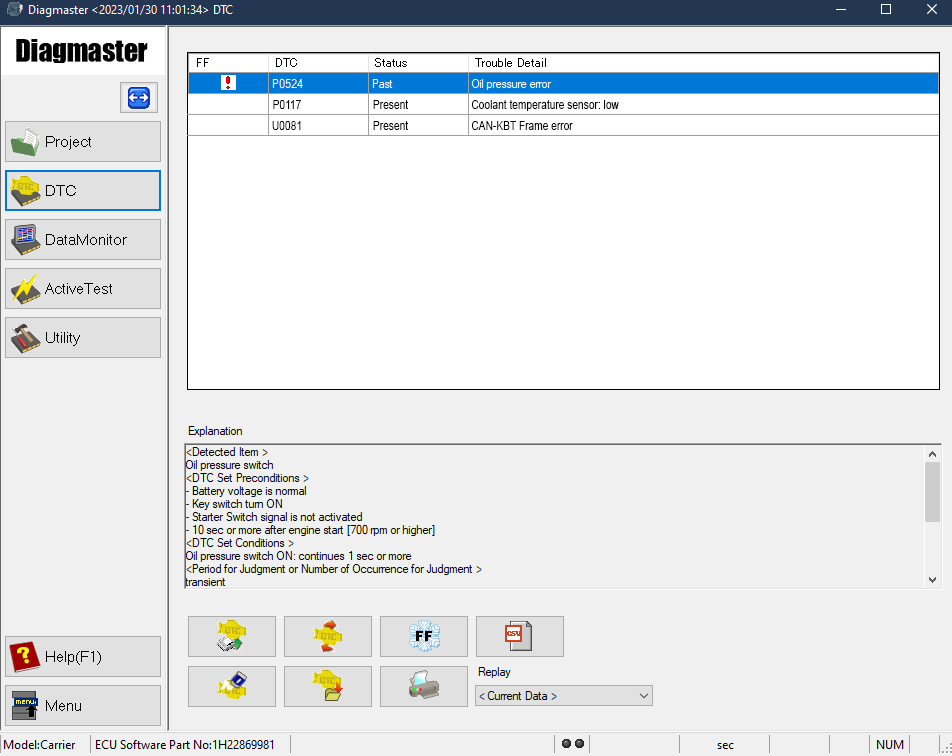
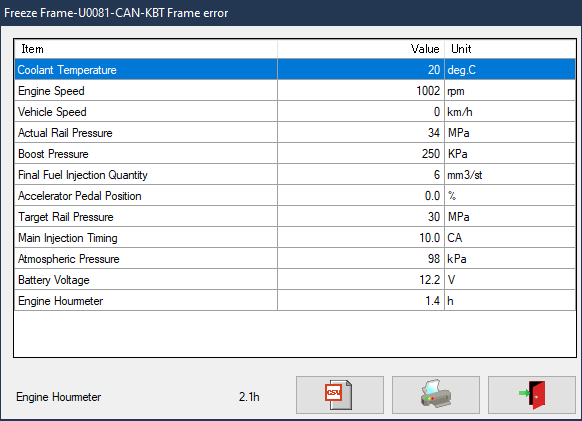
•The FF column will have an exclamation mark if freeze frame data is saved for that DTC. Freeze frame data is a vehicle control dataset including engine speed and coolant temperature saved in the ECU memory at the moment a DTC is detected.
•The DTC column is the 5 digit code for the DTC code.
•The Status column shows whether the DTC is a current or past failure.
•The Trouble Detail column is a summary of the possible cause of that DTC.
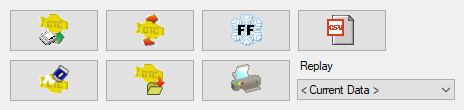
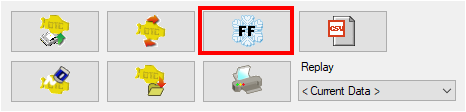
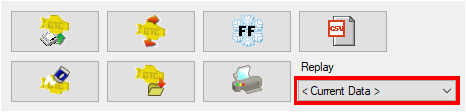
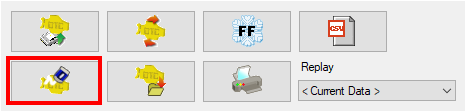
At the bottom of the screen are the following buttons starting from top row, reading left to right:
•Read DTC
•Read DTC successively
•Display Freeze Frame data
•Save data in CSV format
•Clear DTC
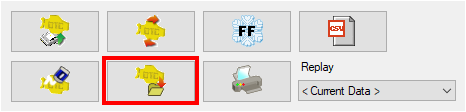
•Save DTC
•Print DTC list
•Replay the history of DTC saved in the same diagnosis
7.3.6.1Displaying Freeze Frame Data
1.If a DTC code has freeze frame data available, it will have the red exclamation mark. Highlight the code and click on the Freeze Frame button.
2.A pop up screen will appear to display the data. From the pop up screen, the freeze frame data can be saved as a CSV file or printed.
1.Click on the Save button to save DTC and Freeze Frame information.
2.A pop up screen appears. A memo can be added prior to saving. The file name for the saved data is automatically chosen. Click the Save button to complete the save.
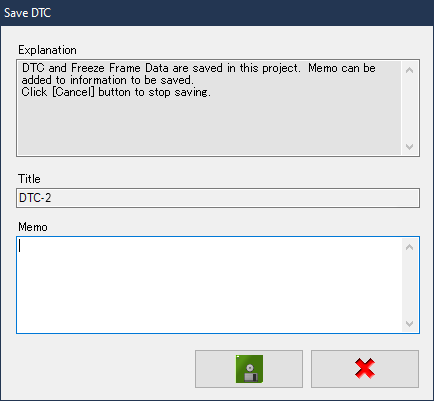
3.The DTC and freeze frame data saved in the project can be viewed with the Replay drop down box.
Clearing a DTS removes it from the DTC screen. Once it is removed it can not be restored. A DTC can only be cleared when it has a status of “Past” and when the same DTC does not exist as “Present” status. A “Present” DTC can not be cleared since the trouble has not been resolved yet.
Be sure to clear a DTC with the vehicle’s engine stopped and the ignition switch ON. Deletion during engine rotation may cause a communication error.
1.Highlight the DTC and click on the Clear DTC button.
2.A pop up screen appears. A memo can be added prior to saving. The file name for the saved data is automatically chosen. Click the Clear button to delete.
3.If a DTC is cleared, the DTC immediately before the cleared data and the freeze frame data are saved in the project information.
This is the procedure for displaying and reviewing a DTC previously saved in the project information.
1.Click on the Replay drop down box. Select one of the saved files from the list. The content of the selected file is displayed in the DTC display at the upper part of the screen.
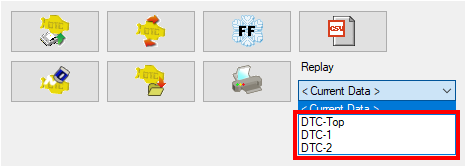
2.To cancel replay, select Current Data in the Replay drop down box.

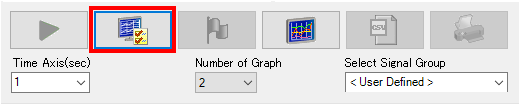
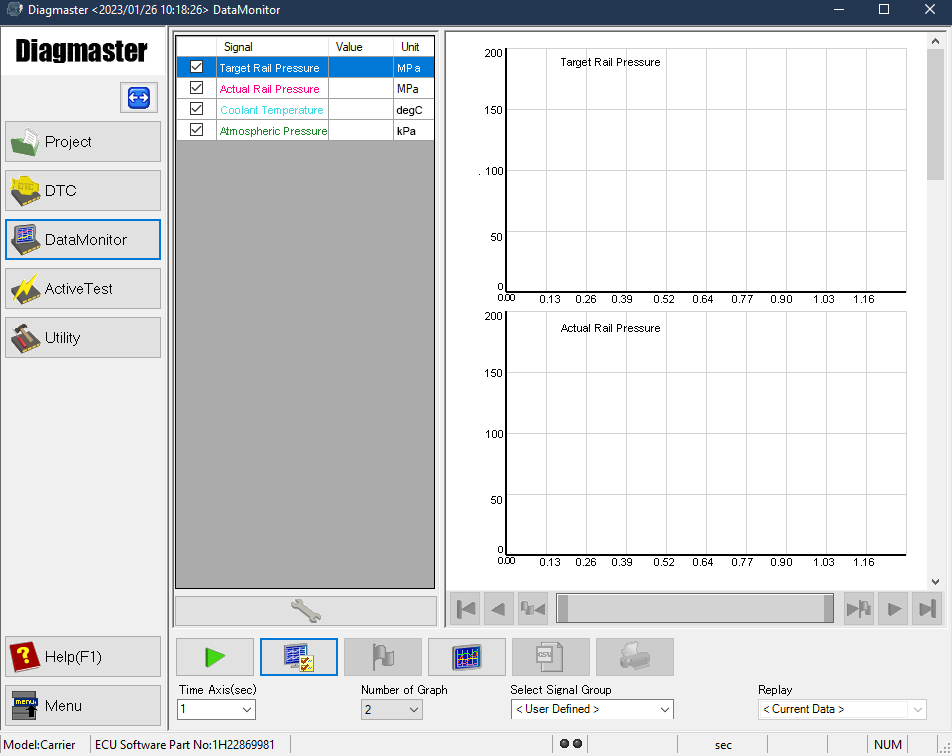
The Data Monitor screen consists of the list area, graph area and operation area. Specific data is chosen to be monitored from this screen and displayed in the graph area.
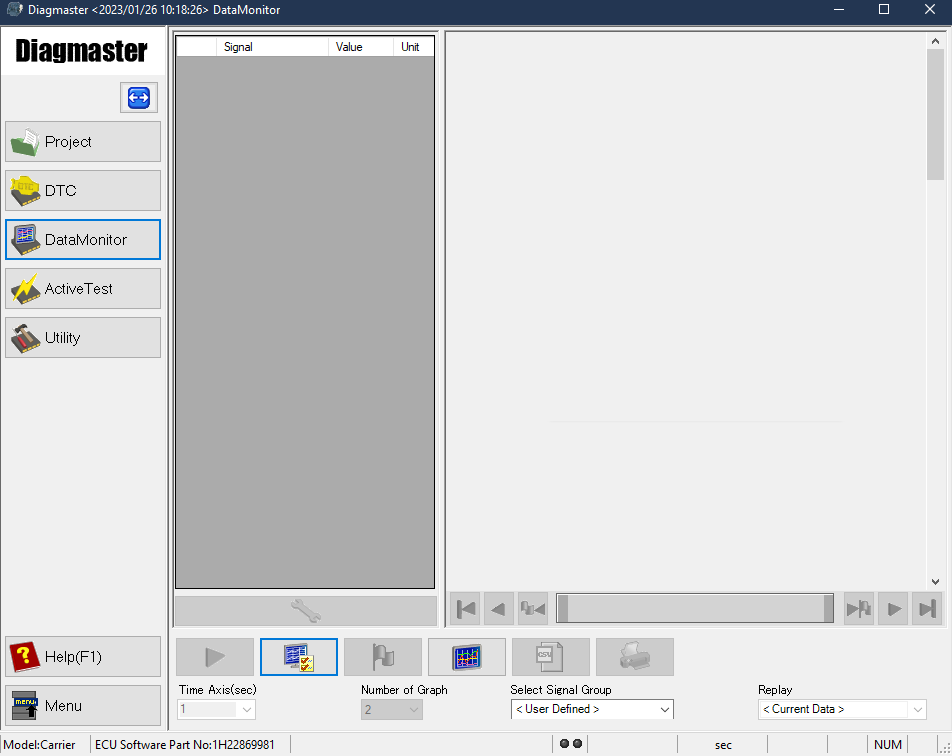
7.3.7.1Recording Data from the Data Monitor Screen
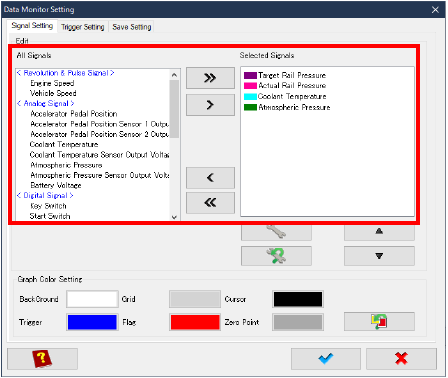
1.Click the Settings button to open the Data Monitor Setting window.
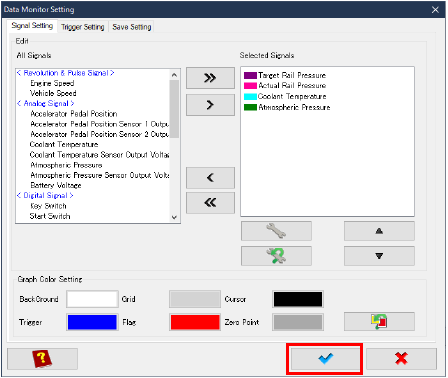
2.The Data Monitor Setting window contains a list of signals that can be measured. Use the right / left arrows to move desired signals between the All Signals and Selected Signals column. The single headed arrows move one signal and the double headed arrows move all signals. Refer to Section 8.4 for Signal descriptions.
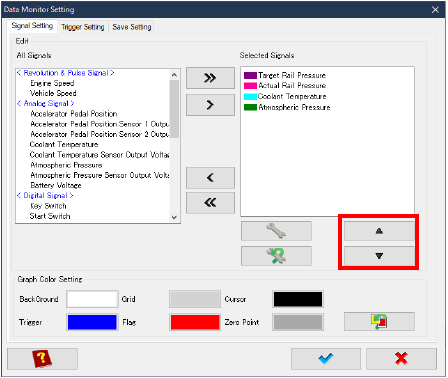
3.Use the up and down arrows to change the order of the Selected Signals column. This will set the display order of the graphs.
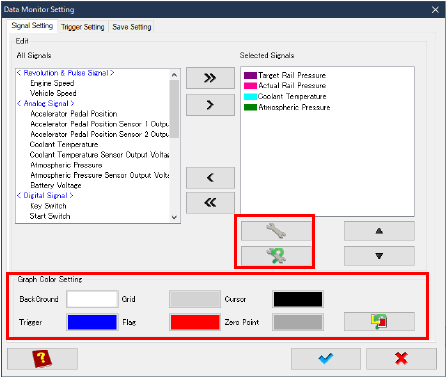
4.The remainder of the selections on this screen are for setting up the appearance of the graph. The two buttons with a wrench icon (top to bottom) are to 1) specify the line color and the range of the Y-axis for each signal and 2) reset the display settings to the default. The bottom row buttons are for setting colors on the graph.
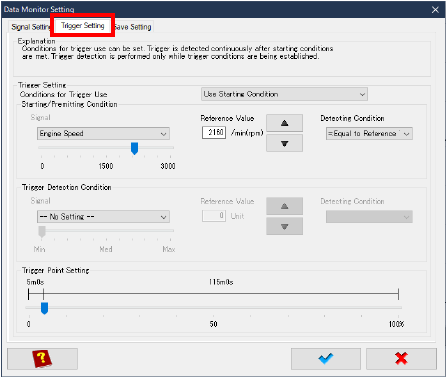
5.Click on the Trigger Setting tab. Make any desired changes.
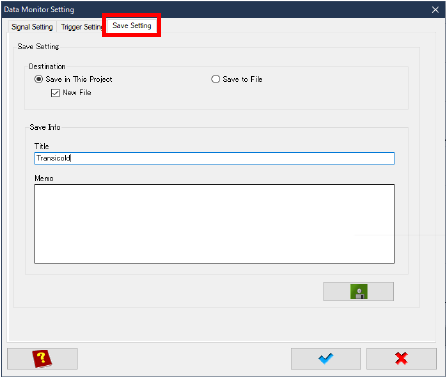
6.Click on the Save Setting tab. To create a new file, enter the title. To overwrite an existing file, select the title of a previously saved file. Choose the desired settings, enter a memo and click the save button below the Memo field. To save the settings in a file, specify the folder name and file name in the common dialog box.
7.When finished with all data monitor settings, click the blue checkmark to complete and close the window.
8.The selected signals appear in the list on the left while the graph representations are on the right.
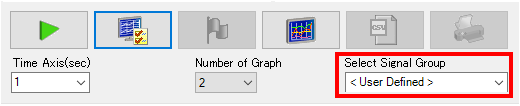
9.Signal settings that have been previously saved are stored in the Select Signal Group drop down box and can offer a way to store favorite settings for quick access.
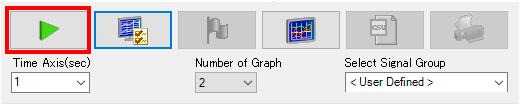
10.Once the Signals are chosen, click the green play button to start the measurement.
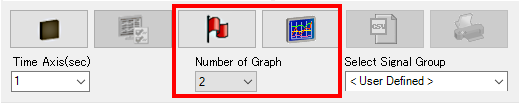
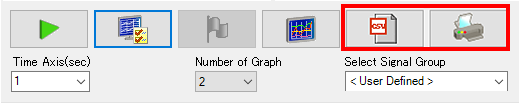
11.The following operations are available during monitoring:
•Adding flags while monitoring data
•Switching the graph display mode between one graph and separate graphs
•Selecting number of graphs (2-5) to display on the screen when separate graphs chosen.
Measured data will be recorded in the memory (on the PC) that can store approximately 2 hours of data. During measurement, the status of memory consumption is displayed in the status bar. When 2 hours of data memory is full, the old data will be overwritten by the new data.
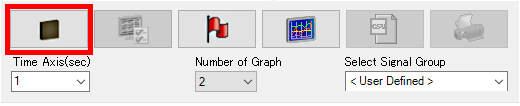
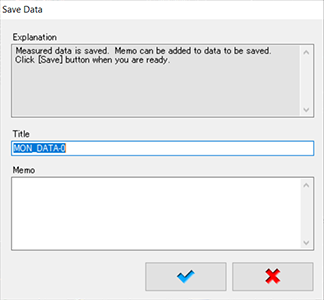
12.Click the stop button to finish the measurement recording. The Save Data popup appears to save the data into the project information. Click the blue checkmark to save to the project.
13.After monitoring, the recorded measurement can be saved as a CSV button or printed.
7.3.7.2Replaying Monitored Data
Data that was previously recorded can be replayed from the Data Monitor screen.
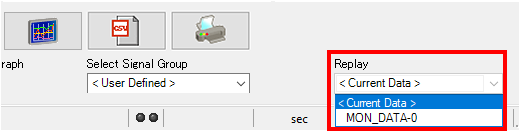
1.In the bottom right corner of the Data Monitor screen, click on the Replay drop down box. When current data is monitored, it will display Current Data. All saved recordings will be listed and can be selected. To cancel replaying, select Current Data from the list.
7.3.8Active Test Item Select Screen
Active test is a function to forcibly drive components via command from Diagmaster. Active Test can assist with checking the circuit from the ECU to actuator and to test the ability of the actuator.
There are only two functions to perform on this screen:
•Stopping an individual injector cylinder (1-4).
•Turning the glow relay ON.
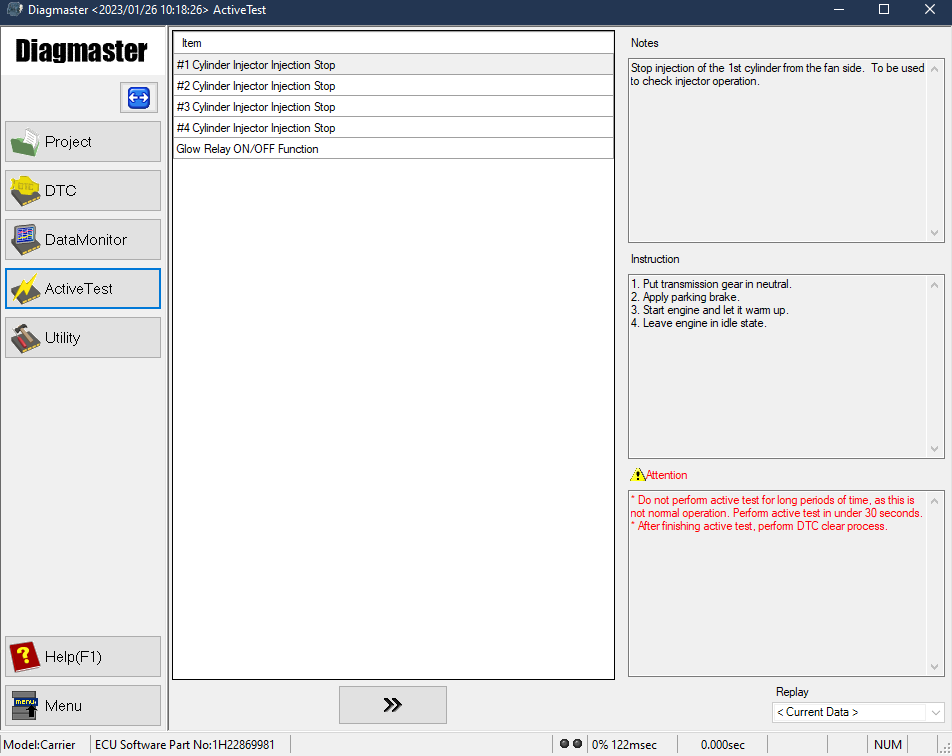
Before performing active tests, check the Notes, Instruction and Attention displayed in the right column of the screen for each item. Incorrect work or operation may result in an unexpected failure.
Since active tests are not a normal operation, prolonged execution may cause failure. Tests should take no more than about 30 seconds.
7.3.8.1Performing an Active Test
1.Select one of the items in the list and click the right arrow. The Active Test Execution screen appears.
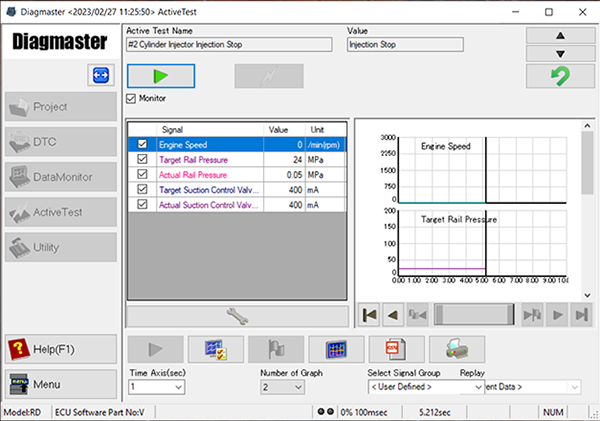
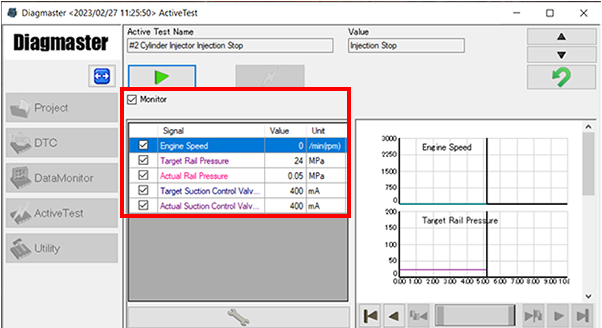
2.Signals can be monitored during execution. To do this, set the signals to be monitored. See Section 7.3.7.1. Once the signal settings are set, click the Monitor check box to enable monitoring.
3.Click the green play button to make active tests ready to be executed. Data monitoring will start if simultaneous monitoring has been selected.
4.Click the yellow button to execute the active test. Driving instructions will be sent to the ECU. Check the operating noise of the actuator. During the active test, flags can be added by clicking the flag button.
5.Click the stop button to finish the test. If data has been monitored, the measured data can be saved with a title and memo.
6.Click the green back button to return to the Active Test Item Select screen.
7.3.8.2Replaying Active Tests
This procedure is to replay an active test that was performed simultaneously with data monitoring. You can not replay an active test unless data monitoring was also recorded.
1.From the Active Test Item Select screen, click on the Replay drop down box in the lower right corner. Select the target file saved from the list.
2.The Active Test Execution screen appears to display the replay of the selected data in the graph.
3.Click the stop button to cancel the replay.
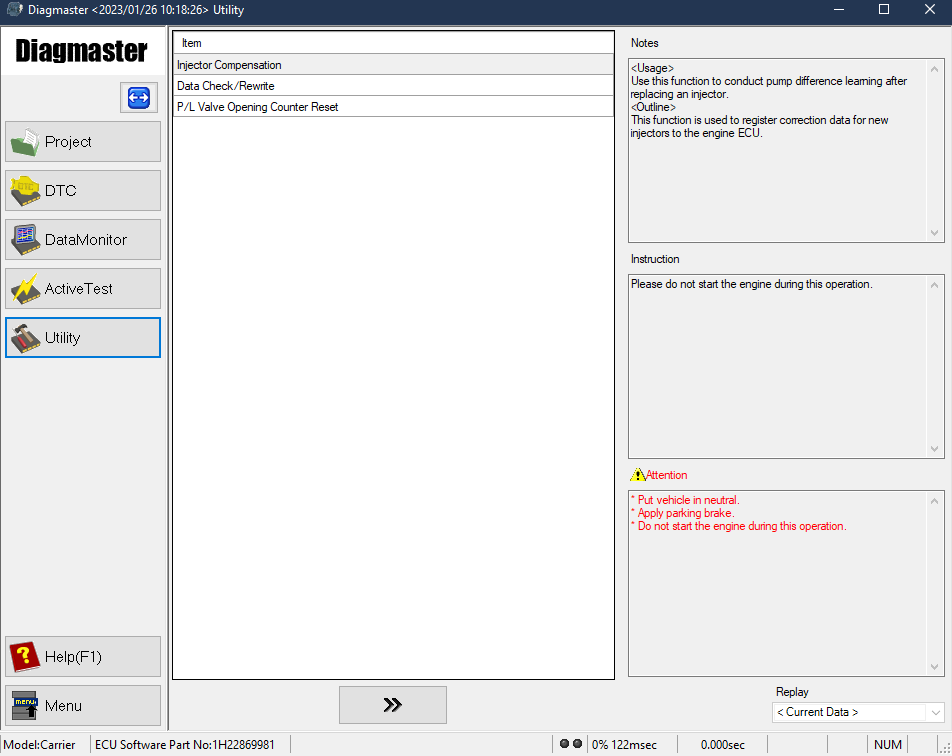
7.3.9Utility Item Select Screen
The Utility Item Select screen provides thee additional functions:
•Injector Compensation
•Data Check / Rewrite
•P/L Valve Opening Counter Reset
Select one of the items in the list and click the right arrow. The appropriate screen appears.
Before selecting a utility item to be performed, check the Notes, Instruction and Attention displayed in the right column of the screen for each item. Carefully read them and make sure you understand them before operation.
This function is performed when an injector or the ECU has been replaced. When registering compensation data to the ECU, stop the engine beforehand. Registration is not possible with the engine running.
1.Select Injector Compensation on the Utility screen and click the right arrow to open the Injector Compensation screen. The injector compensation values currently saved in the ECU are displayed.
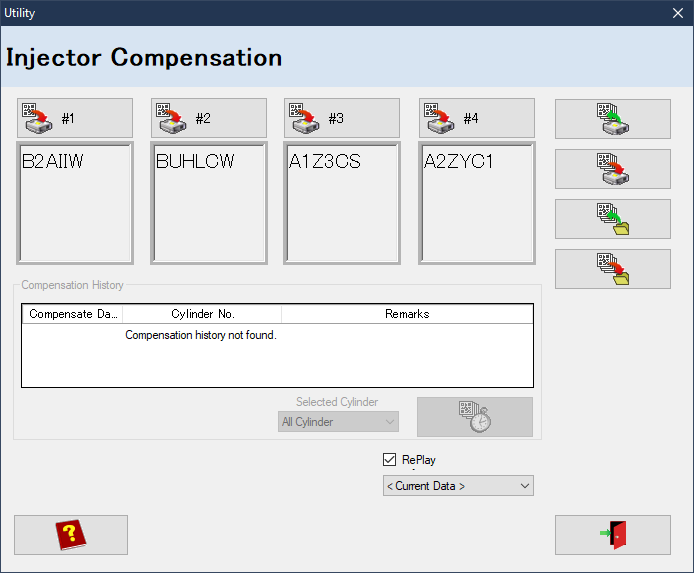
2.Click on any register individual injector button. Or, click on the register all injectors button to register all injectors at once.
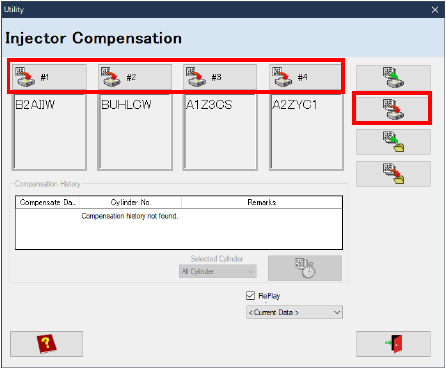
3.A confirmation screen will appear. To rewrite the data, click the OK button. When rewriting is complete, a Registered message will appear.
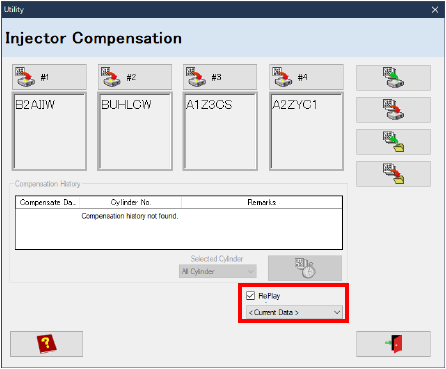
7.3.9.2Replay Registered Compensation Data
When compensation data is registered, its history is automatically saved in the project.
1.Click on the drop down list under Replay. Select the target saved file from the list. To cancel replay, click on Current Data from the drop down list.
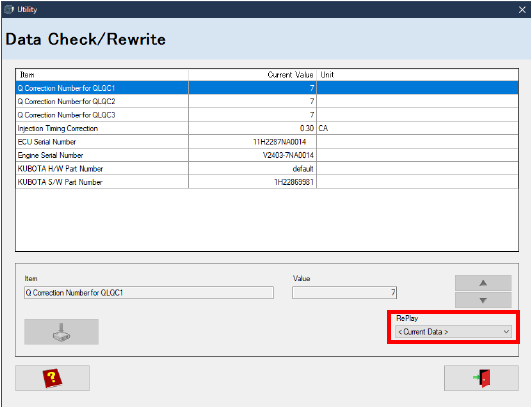
7.3.9.3Data Check / Rewrite
This screen will allow a user to check and rewrite the values contained in the ECU.
1.Select Data Check / Rewrite from the Utility screen to open the Data Check / Rewrite values.
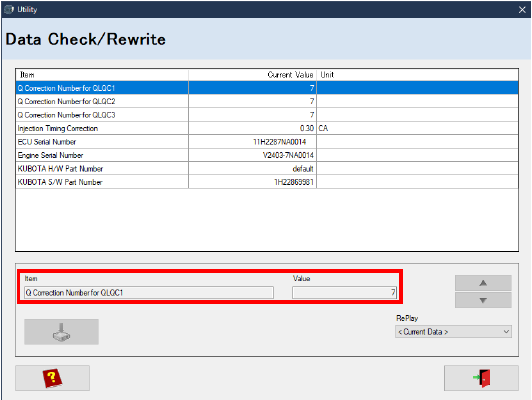
2.Select the item to be rewritten. Change the value and click the Save button to execute the change.
3.Check the content of the displayed precautions in the popup and click the blue checkmark to confirm.
4.A confirmation screen for rewriting will appear. Click OK to complete.
5.If the rewriting properly executed, the label of the rewritten signal changes to a blue color with a completion message.
7.3.9.4Replaying Rewritten Data
When data is rewritten, its history is automatically saved in the project.
1.Click on the drop down list under Replay. Select the target saved file from the list. To cancel replay, click on Current Data from the drop down list.