Section 6
This section describes the features available on the ViewData screen. The ViewData utility generates reports that contain data downloaded from the DataCorder. These reports are used to analyze DataCorder data stored in a DCX file. The generated reports are stored in a report directory. The user also has the ability to define and generate customized reports.
The application allows for four methods to launch the ViewData utility:
1.From the Application Launch Pad screen, click on the “ViewData” button in the Tools Group Box.
2.From the Interrogator screen (if a connection is complete), check the box marked “View Data After Interrogation.”
3.From the Data Manager screen, select a row in the “List of Files” and click on the “ViewData” button.
4.From the Data Manager screen, right-click anywhere on the selected row in the “List of Files” Group Box. A pop up menu appears with three options. Click on “Launch ViewData”.
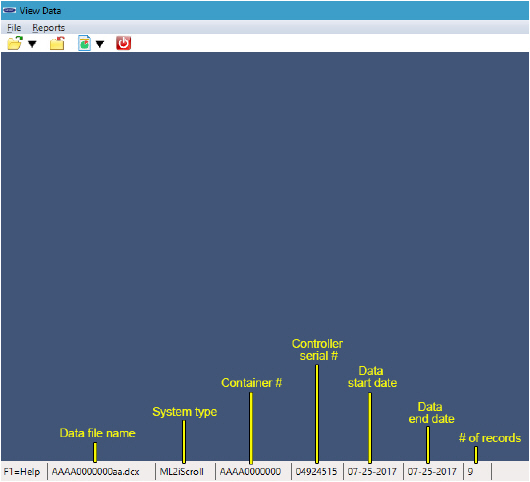
The ViewData screen (Figure 6.1) is displayed when the user clicks on the ViewData button in the Tools Group Box on the Launch Pad. The screen is blank until a file and report are selected.
Opening and viewing the data is a 2-step process.
1.To open a DCX file from the ViewData screen, click on the File menu option and select “Open”. After the file has been opened, the DCX file details are populated at the bottom of the screen.
The DCX file details displayed at the bottom of the screen from left to right are:
•Data file name
•System type
•Container number
•Controller serial number
•Data start date
•Data end date
•Number of records in file
2.With the file open, click on the Reports menu option to select the report type.
This section describes the features available to generate standard and custom reports.
The following reports can be generated by utilizing report templates defined by the application. A DCX file must be open prior to generating any of the reports.
•Graphic Report - view sensor data and event acronyms for identified events over a selected range of dates in a graphical format. Table 6–1 lists the event acronyms and descriptions.
•Temperature Chart Report - view SRS, RRS and Setpoint sensor data over a selected range of dates in a graphical format. User can either select the linear temperature graph to view the sensor data in a linear graph format or select the circular temperature graph to view the sensor data in a circular format.
•Sensor Report - display the sensor data over a selected range of dates.
•Sensor Data Report - display the sensor data over a selected range of dates and event acronyms for identified events. Table 6–1 lists the event acronyms and descriptions.
•Event Report - display the event data over a selected range of dates.
•Sensor and Event Report - display the event and sensor data over a selected range of dates. The user can select the sensors to be displayed. This report will also display sensor configuration information.
•Cold Treatment Summary Report - display the activity of the selected USDA and Cargo sensors with respect to their operation within predefined temperature ranges over a selected range of dates.
•TripWise Summary Report - display the status of Run Time Diagnostics (TripWise) and supporting RTD test results and data for a user selected RTD Status event.
•Controller Pretrips Report - display the pretrip results over a selected range of dates.
•Alarm Summary Report - display Controller, DataCorder, and CA alarms over a selected range of dates.
•Raw Data Report - display the event and sensor data over a selected range of dates. This report will also display sensor configuration information.
Select the type of report for generation from the Report menu, e.g. graph report, and click to launch the Create Report screen.
The CreateReport screen (Figure 6.2) is displayed when the option to create a sensor, sensor data, sensor and event, cold treatment summary, or a graph report is chosen.
Figure 6.2 CreateReport Screen
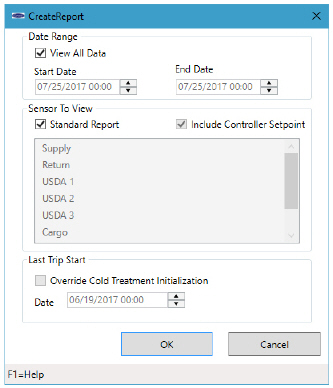
The date range criteria can be selected for all report types by deselecting the “View All Data” checkbox. The user is then allowed to select the start and end date. If the start date selected by the user is after the end date, the application switches the dates.
The available sensors for the report are listed under “Sensor To View” and can be selected by highlighting the sensor name. Only five sensors can be chosen to be displayed on a sensor graph report. For the Graphical report, only supply and return sensors can be selected.
The “Last Trip Start” Group Box is enabled only for Cold Treatment Summary Report.
The Report Date Range screen (Figure 6.3) is displayed when the user chooses to create any type of a report other than a sensor, sensor data, sensor and event, cold treatment summary or graphic report.
Figure 6.3 Report Date Range Screen
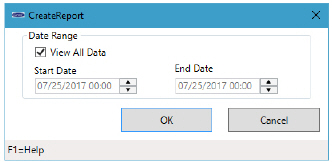
The date range criteria can be selected for all report types by deselecting the “View All Data” checkbox. The user is then allowed to select the start and end date. If the start date selected by the user is after the end date, the application switches the dates.
After a report has been generated, the following options are enabled. For a graph report, the Page Setup and Find options are not available.
•Save Report As
•Close Report
•Print Preview
•Page Setup
•Find
Each report (with the exception of the graphic report and temperature charts) displays a header that contains the following information:
•Report Title
•Container ID
•Report Date Range
•Interrogation Data
•Name and Version of DataLINE software used for extracting the DCX file
•Controller Software Version
•DataCorder Software Version
•Interrogation File Comment
•Calibration Values for USDA 1,2,3 and Cargo sensors
•Controller Serial Number
•Temperature Units
In addition to the above information, the Cold Treatment Summary also includes information for “Cold Treatment Initialization.”
The graphic report and temperature charts contain no header.
All temperature units are chosen through the Program Options utility.
6.3.1Create Custom Report Template
This section describes the features available to create a custom report template.
To create a custom report template, select the “Define Custom Template” option from the Report menu on the ViewData screen and select one of the following report types.
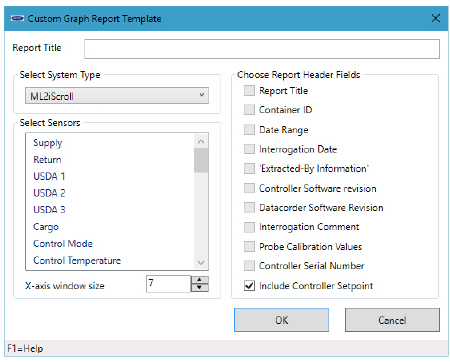
•Graphical - The graph report contains no header fields. The X-axis window size is defaulted to 24 for graph reports. The X-axis window size can be set between 24 - 48. The “Include Controller Setpoint” checkbox appears on the Custom Graph Report Template screen. Select from the list box the sensors to be included in the report. Only five sensors can be chosen for a graphical report.
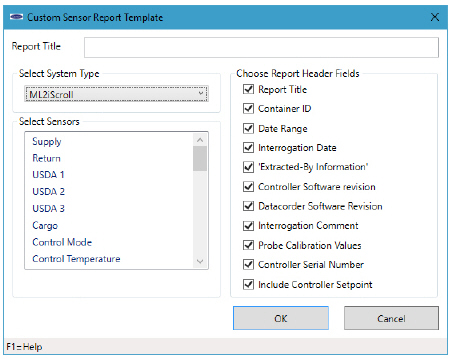
•Sensor - The sensor report contains header fields as well as the “Include Controller Setpoint” checkbox that appears on the Custom Graph Report Template screen. Select from the list box the sensors to be included in the report.
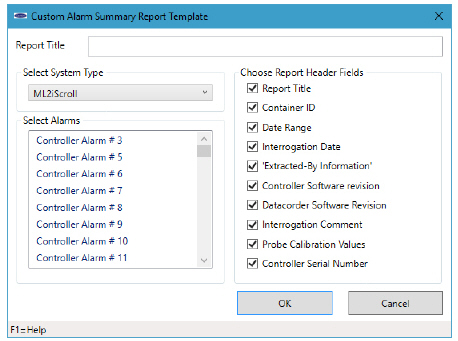
•Alarm - The alarm report contains only header fields and the user can select from the list box the alarms to be included in the report.
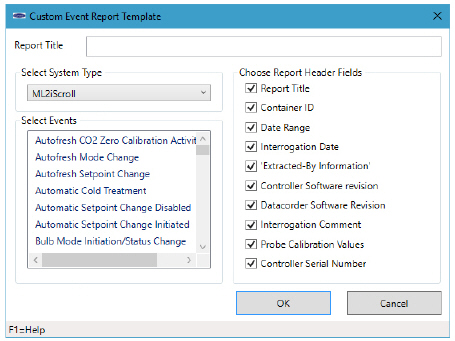
•Event - The event report contains only header fields and the user can select from the list box the events to be included in the report.
The Custom Graph Report screen (Figure 6.4) is displayed when the option to create a Custom Graph Report template is chosen.
Figure 6.4 Custom Graph Report Screen
The Custom Sensor Report screen (Figure 6.5) is displayed when the option to create a Custom Sensor Report template is chosen.
Figure 6.5 Custom Sensor Report Screen
The Custom Alarm Summary screen (Figure 6.6) is displayed when the option to create a Custom Alarm Summary Report template is chosen.
Figure 6.6 Custom Alarm Summary Screen
The Custom Event Report screen (Figure 6.7) is displayed when the option to create a Custom Event Report template is chosen.
Figure 6.7 Custom Event Report Screen
The “OK” button is disabled initially.
Enter a minimum of three characters (max of 30 is allowed) in the “Report Title” text box to enable the “OK” button.
Select at least one sensor from the “Select Sensor” list box (maximum of five sensors if “Include Controller Setpoint” is selected) by highlighting the sensors to be included.
Click “OK” on the “Custom Report Template” screen to create the Custom Report template.
After a custom template is created, it is automatically stored for future use. The custom templates that have been created can be accessed by selecting the “Custom” option from the Reports menu on the ViewData screen.
The section describes the features available to generate a custom report.
The Generate Custom Report screen (Figure 6.8) is displayed when the “Custom” option is selected from the Reports menu on the ViewData screen.
Figure 6.8 Generate Custom Report Screen
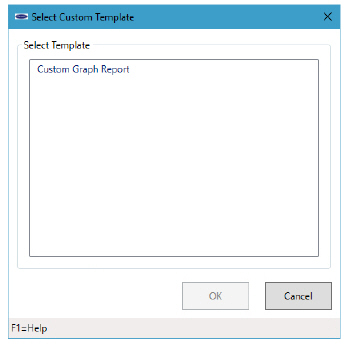
To display the Create Report screen, the user must select a custom template from the “Select Template” list box and click “OK”.
The section describes the features for changing the appearance of a page through the Page Setup screen.
The Page Setup screen (Figure 6.9) is displayed when the “Page Setup” option is chosen from the File menu on the ViewData screen.
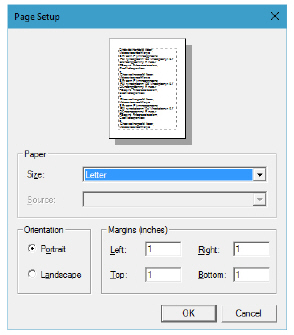
The default for all margins is 1.00 inches. The margin value can be changed by clicking on the up/down control or by manually entering a margin value. The minimum value for the left and right margins is 0.25 inches and the maximum value is 2.00 inches. The minimum value for the top and bottom margins is 0.75 inches and the maximum value is 2.00 inches.
Upon changing the page setup of a generated text report, the changes will become the default settings for the text reports generated going forward, unless the user changes them again or re-launches the application.
This section describes the features for previewing a page through the Print Preview screen before beginning to print.
The Print Preview screen (Figure 6.10) is displayed when the “Print Preview” option is chosen from the File menu on the ViewData screen.
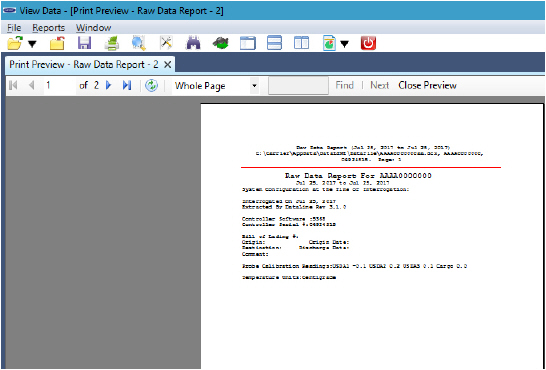
To change the size of the previewed report, click on the zoom drop down list.
To select a page of the report for viewing, click on the “First Page”, “Previous Page”, “Next Page”, or “Last Page” arrow buttons located at the top of the screen.
If the user clicks on the printer icon at the top of the screen, the Print Preview screen closes and the standard Windows Print dialog box appears.
To begin printing, select the appropriate printer settings and click “OK”.