Section 12
This section describes the features available on the Monitor screen. DataLINE provides an interface to monitor the status of the refrigeration unit's analog inputs/outputs and discrete inputs/outputs for diagnostic purposes. The utility provides the ability to log selected inputs/outputs to a space delimited text file. The capability to edit and send variable values to the refrigeration unit for override is also provided.
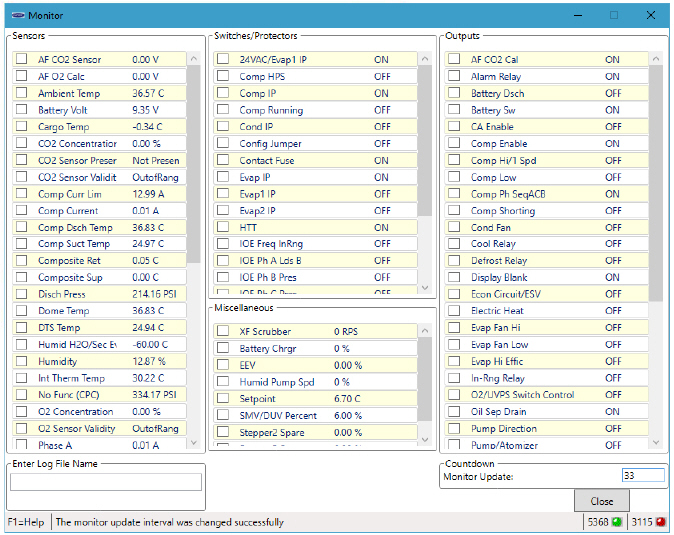
The Monitor screen (Figure 12.1) is displayed when the user clicks on the Monitor button in the Container Group Box on the Launch Pad.
The DataLINE application refreshes the screen in one of the two following ways:
•AutoRefresh - The utility provides the ability to specify an auto-refresh interval (monitor update interval). When monitor update interval expires, the Monitor screen automatically updates all data on the screen.
•F9 - Provides the user with shortcut for manually triggering the refresh operation.
The Monitor utility provides the ability to log selected inputs/outputs to a space delimited log file at regular intervals, override variable values and cancel variable overrides.
Log Monitor Data into the Log File:
1.Enter a log file name in the field displayed in the “Enter Log File Name” Group Box (Figure 12.2). The Monitor screen is displayed when the user enters a log file name.
Figure 12.2 Enter Log File Name
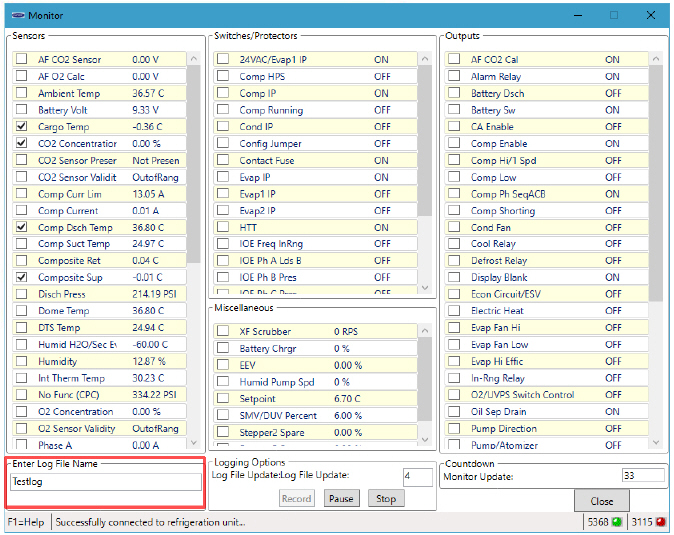
2.The user can specify the interval at which they want to log data into the log file.
3.After selecting variables for logging, click on the “Start” button in the “Logging Options” Group box. The Monitor screen (Figure 12.3) is displayed when the user selects variables and clicks on “Start” button.
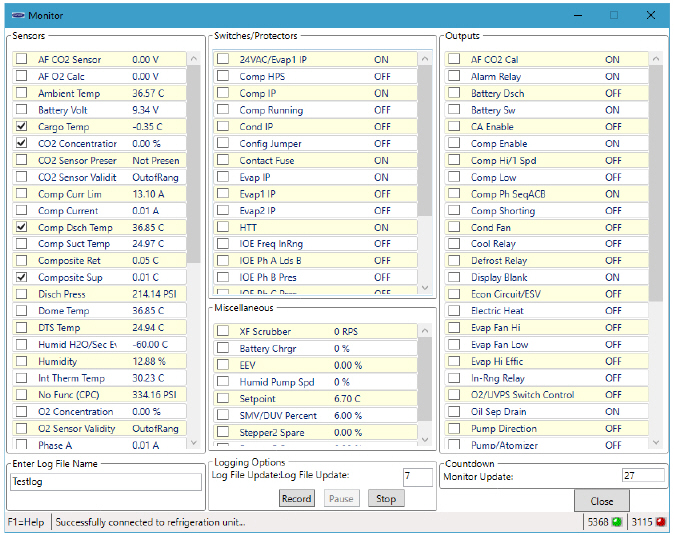
4.Click on the “Pause” button to pause logging.
5.Click on “Stop” button to stop logging.
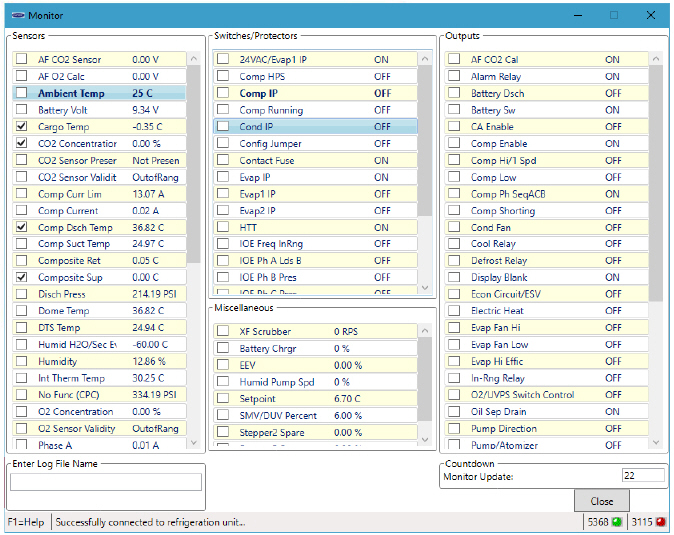
12.4Override Variable Value Screen
Before starting to override variable values, verify that a successful connection is established with the controller and/or CA.
The user can determine status of connection as follows:
•The connection is established only with the CA; the values of CA variables are displayed in all four lists.
•The connection is established only with the controller; the values of controller variables are displayed in all four lists.
If the connection is not established with the controller or CA:
•For analog variables, the X's are displayed in the same format as they would be displayed if the source component is connected.
•For discrete variables, XX is displayed.
•The user will be unable to override the variable values to the unconnected component.
If at any time during the display of the Monitor screen the connection is not established or is lost, the user is alerted to the status of the connection.
To edit the variable value, press 'ALT+W' or 'ALT+SHIFT+W' or 'Alta' or 'Shiftless', or double click on the variable value. After editing the variable value and ensuring a successful connection has been made with the controller or CA, press “Enter” key on the keyboard to override variable value. The variable row is displayed in bold. The following screen (Figure 12.4) is displayed upon pressing “Enter” key.
The user does not have the capability to override the Miscellaneous variable, Remote SMV Percent, using the DataLINE application.
The user can write or override the Miscellaneous variable, Setpoint, using the DataLINE application. However, the override flag is not set and therefore Setpoint variable row will not be shown in bold.
The user has the capability to cancel variable override.
To cancel variable override, press 'ALT+C' or 'ALT+SHIFT+C' or 'Altaic', or 'Shiftless' while the variable's value is selected in the list. The variable row is displayed in regular (non-bold) font.